I’m a data guy. It took me a while though.
For a long time, Andy & I just operated on feel when it came to Paper Leaf, our design agency. Because it was only the two of us for the first couple of years, we could get away with that – there wasn’t much overhead, and you don’t need that many projects to keep busy when there are only two people.
As we’ve grown, though – we’re at 7 people at the time of this post – I’ve learned to track more & more data about our company. It’s not just that numbers are interesting. Having data means we can spot trends, have measurable goals for the business, and more on a month-to-month basis. There’s a lot you can learn from numbers.
So I’m going to share those numbers with you.
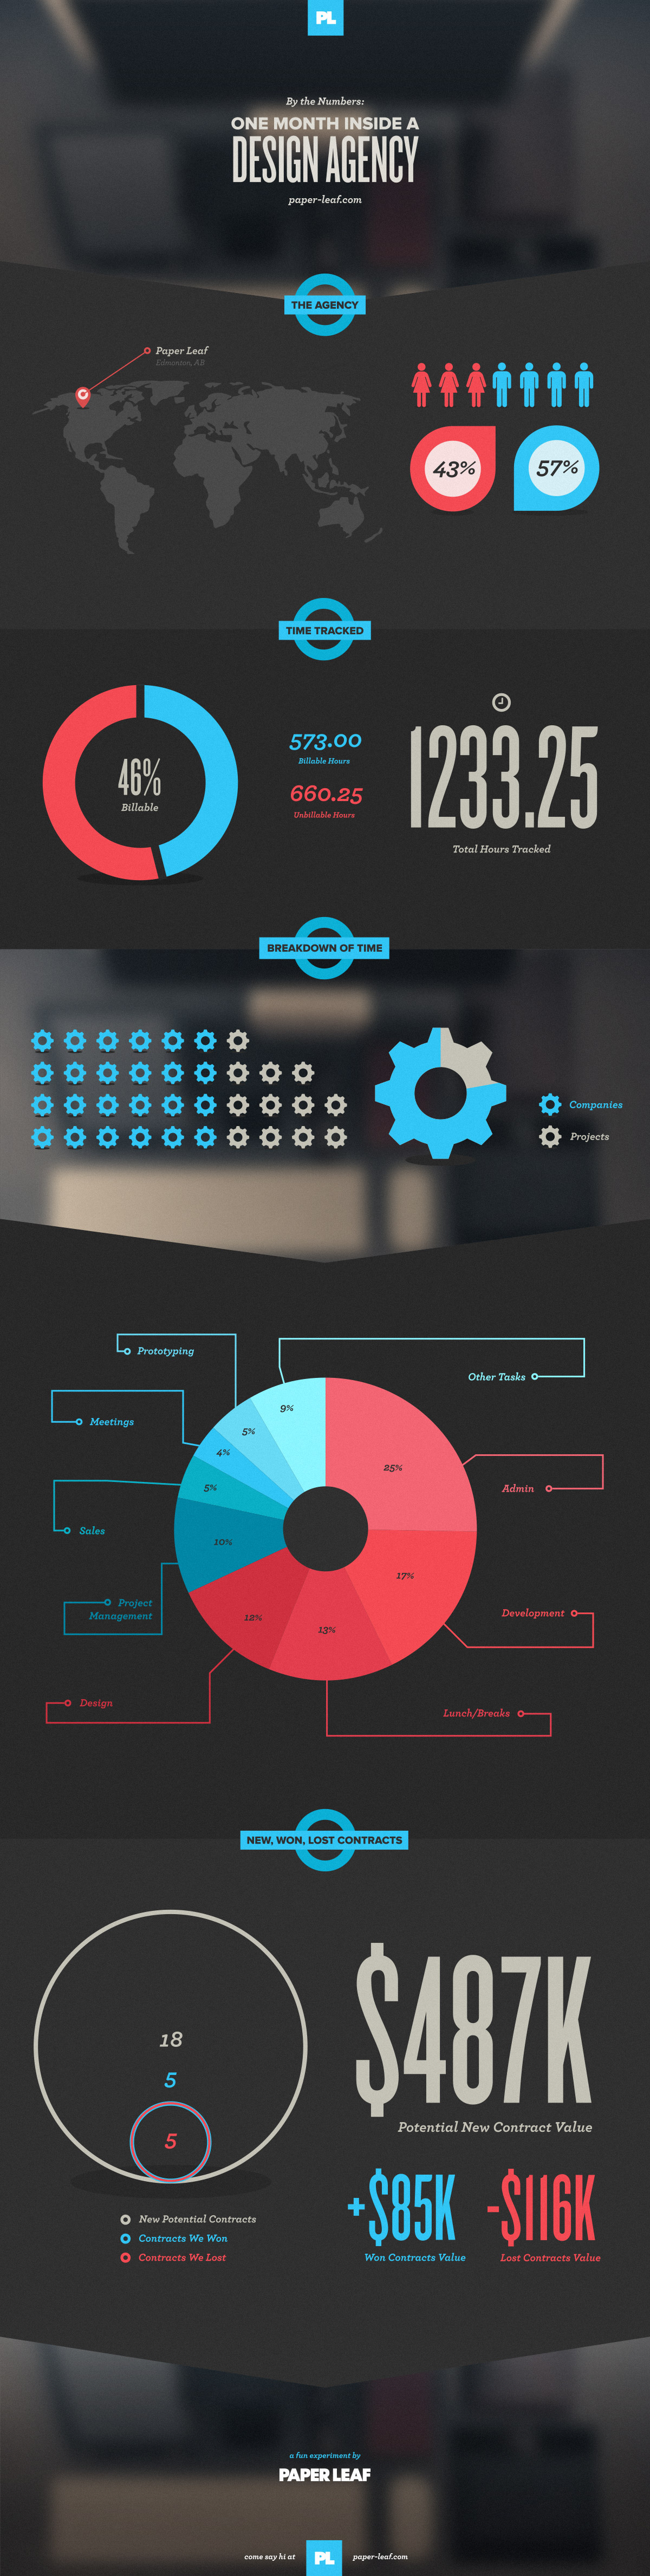
I think there’s value in transparency, and there’s nothing more transparent than raw numbers behind a business. With that in mind, I took some of the monthly data we track at Paper Leaf and made an infographic, which you can find below. In the infographic, you’ll learn a little bit about Paper Leaf – but mainly, you’ll see data like how many hours we track; how billable we are as a shop; how our time is split up; how much revenue (contractually) we won & lost; and more. Take a look below, and I’ll explain some anomalies after the graphic.
A Month in a Design Agency By the Numbers [Infographic]
Details on the Infographic Data
The data in the infographic is all from the previous month (March) at Paper Leaf. Largely, the data comes from two applications we use: Harvest and Pipedrive (both highly recommended, by the way).
It was a busy month at the shop. However, there were a few vacation and sick days taken – plus we’re still setting up our new office – so the data is relatively indicative of an average month for us in terms of tracking time, billable vs. unbillable time, and so forth. I wasn’t surprised or anything by the Time Tracked data – our goal right now, shop-wide, is 50% – but I was surprised at the Breakdown of Time data.
36 different projects for 24 different clients… in one month?!? That’s a little ridiculous for a 7 person shop. Keep in mind, of course, some of those “projects” are really quick jobs – a couple of hours – but still. The cognitive load to deal with that many different moving parts is heavy. My takeaway? We need to dial that back in future months.
Another item that surprised me – it’s an anomaly – is the potential new contract value that came in last month (an estimated, and ridiculous, $487,000). That number is a total outlier; February was a quarter of that amount. I mean, hey – I’m not going to complain. Maybe my proposals are getting better or something. It is important, though, to recognize that it’s not standard for us to get that many inquiries for that amount of estimated revenue in a month. Still, it’s accurate for March.
The Value of Business Data
In the end, tracking data is invaluable to understanding a business – and a much more responsible way to operate than by gut feel. Now you know what we track, and what a month for us as a small design shop looks like. Now it’s your turn – get out there and start tracking numbers!
Embed This Infographic
If you want to embed this infographic on your site, go right ahead. Just copy the code below and paste it into the Text/Code editor view on your post editing screen.